
Explorations with xy
by Kasey Nored
We graphed ![]() and the image is
and the image is 
We add xy and graph the equation ![]() and this image is
and this image is 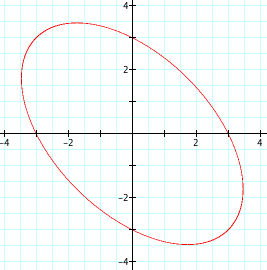
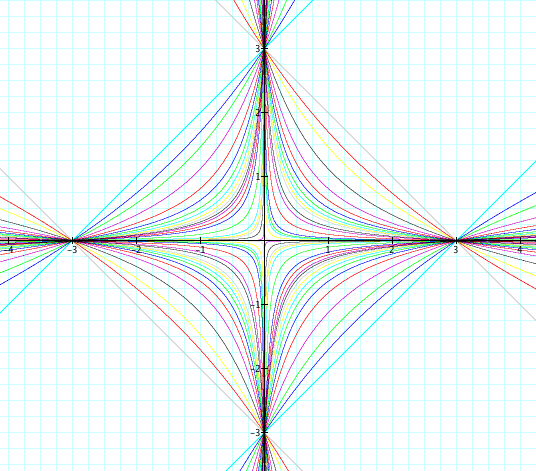
If we begin manipulating our xy term we have some interesting graphs. Below are 26 different graphs using only positive xy's.
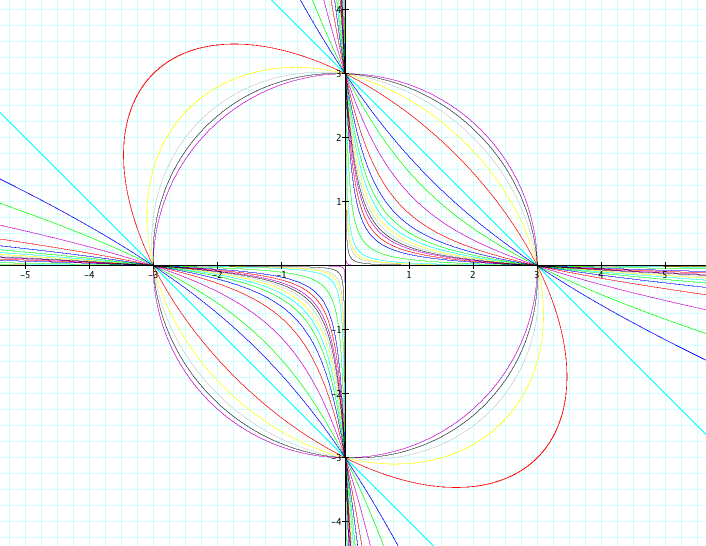
As you can see our ellipse becomes a hyperbola.
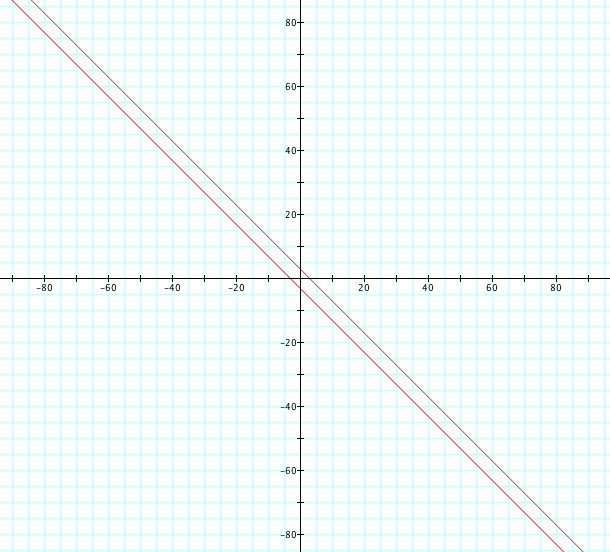
Our intercepts are 3 and -3. Interestingly the light blue line above that looks like it is a straight line is the equation ![]() if we zoom out we see the graph below.
if we zoom out we see the graph below.

The image becomes pixilated but if we graph the facotred form of ![]() we see the following.
we see the following.
By definition this graph is two linear equations. Perhaps more familar looking equations would be 
When we change xy to negative we get
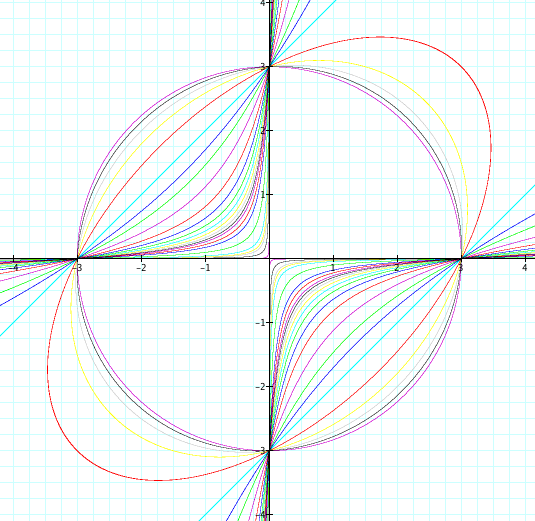
If we graph positive and negative values of xy where xy is 2 or greater we see
Looks like a new way to construct a God's Eye to me.
So by varying xy we have transformed from a circle to an ellipse to a set of linear equations to hyperbolas.
Return to EMAT 6680
Return to my page